Open an execution
The header identifies the service, entry point, team, environment when set, and request timing. Its status badge describes the root’s result, or the recording’s running/abandoned state before that result arrives. A separate coverage indicator reports recording issues. Select the root and open Info to inspect the trace ID, step count, tags, SDK version and available service loss information. Selecting another call changes the panel to STEP DETAILS. Its Info tab shows the selected attempt’s status, duration and start offset.Follow call relationships
Use a recording from your application, or run the checkout example to inspect the calls shown below. The checkout recording has fourteen calls. It uses fixed local customer, inventory and processor data; it does not send a payment or change inventory. It validates an order, loads the customer, calculates a price, checks inventory and creates a receipt after payment recovery. Pricing calculates line prices through nestedprice_lines, line_total and unit_price calls,
then applies a loyalty discount and tax.
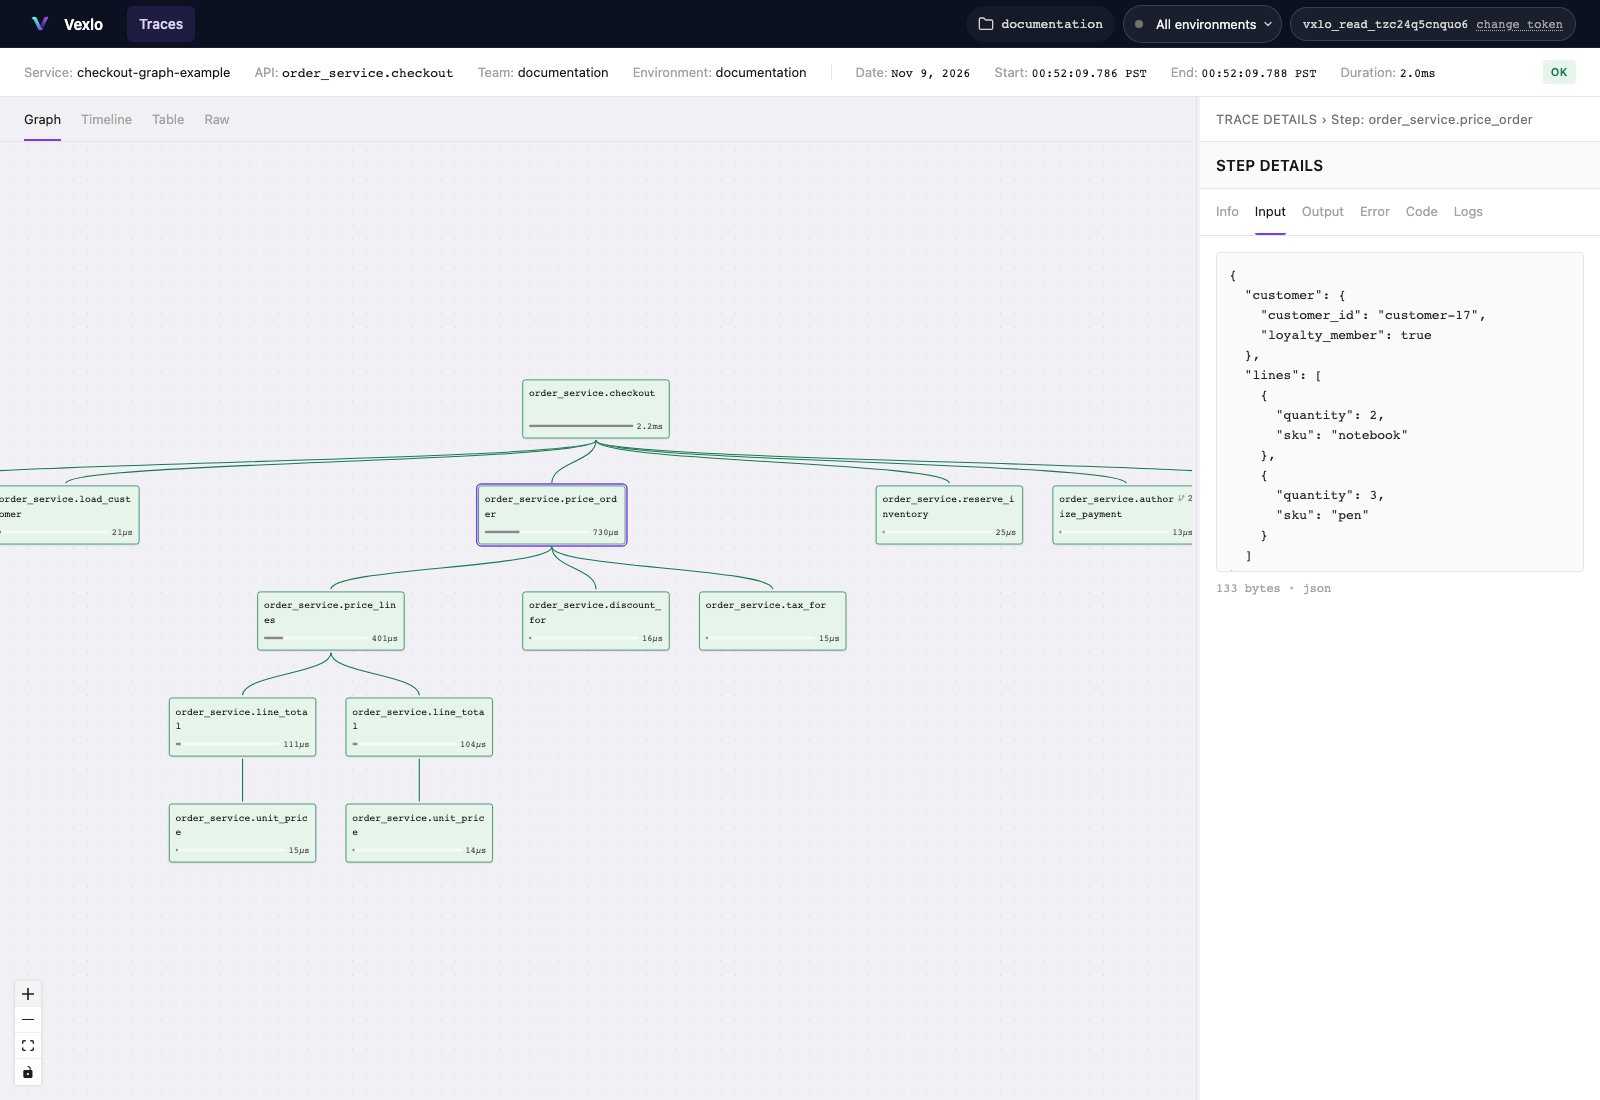
Graph view with the pricing call selected and its input loaded.
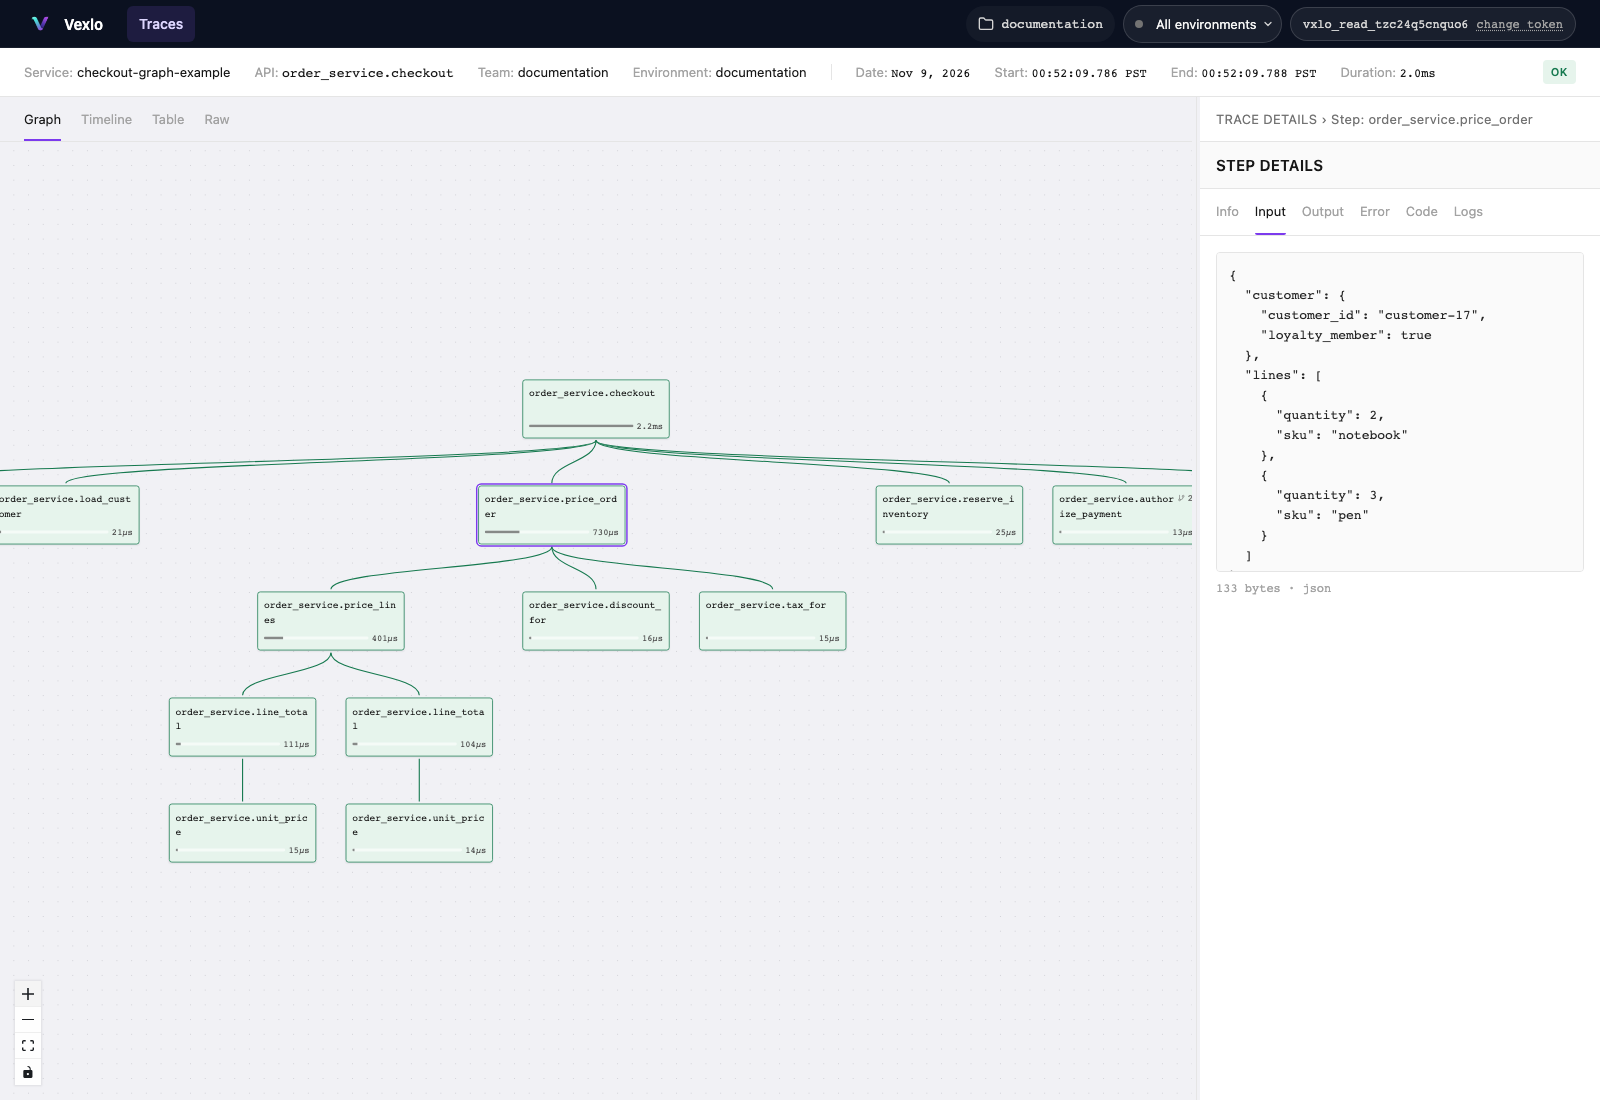
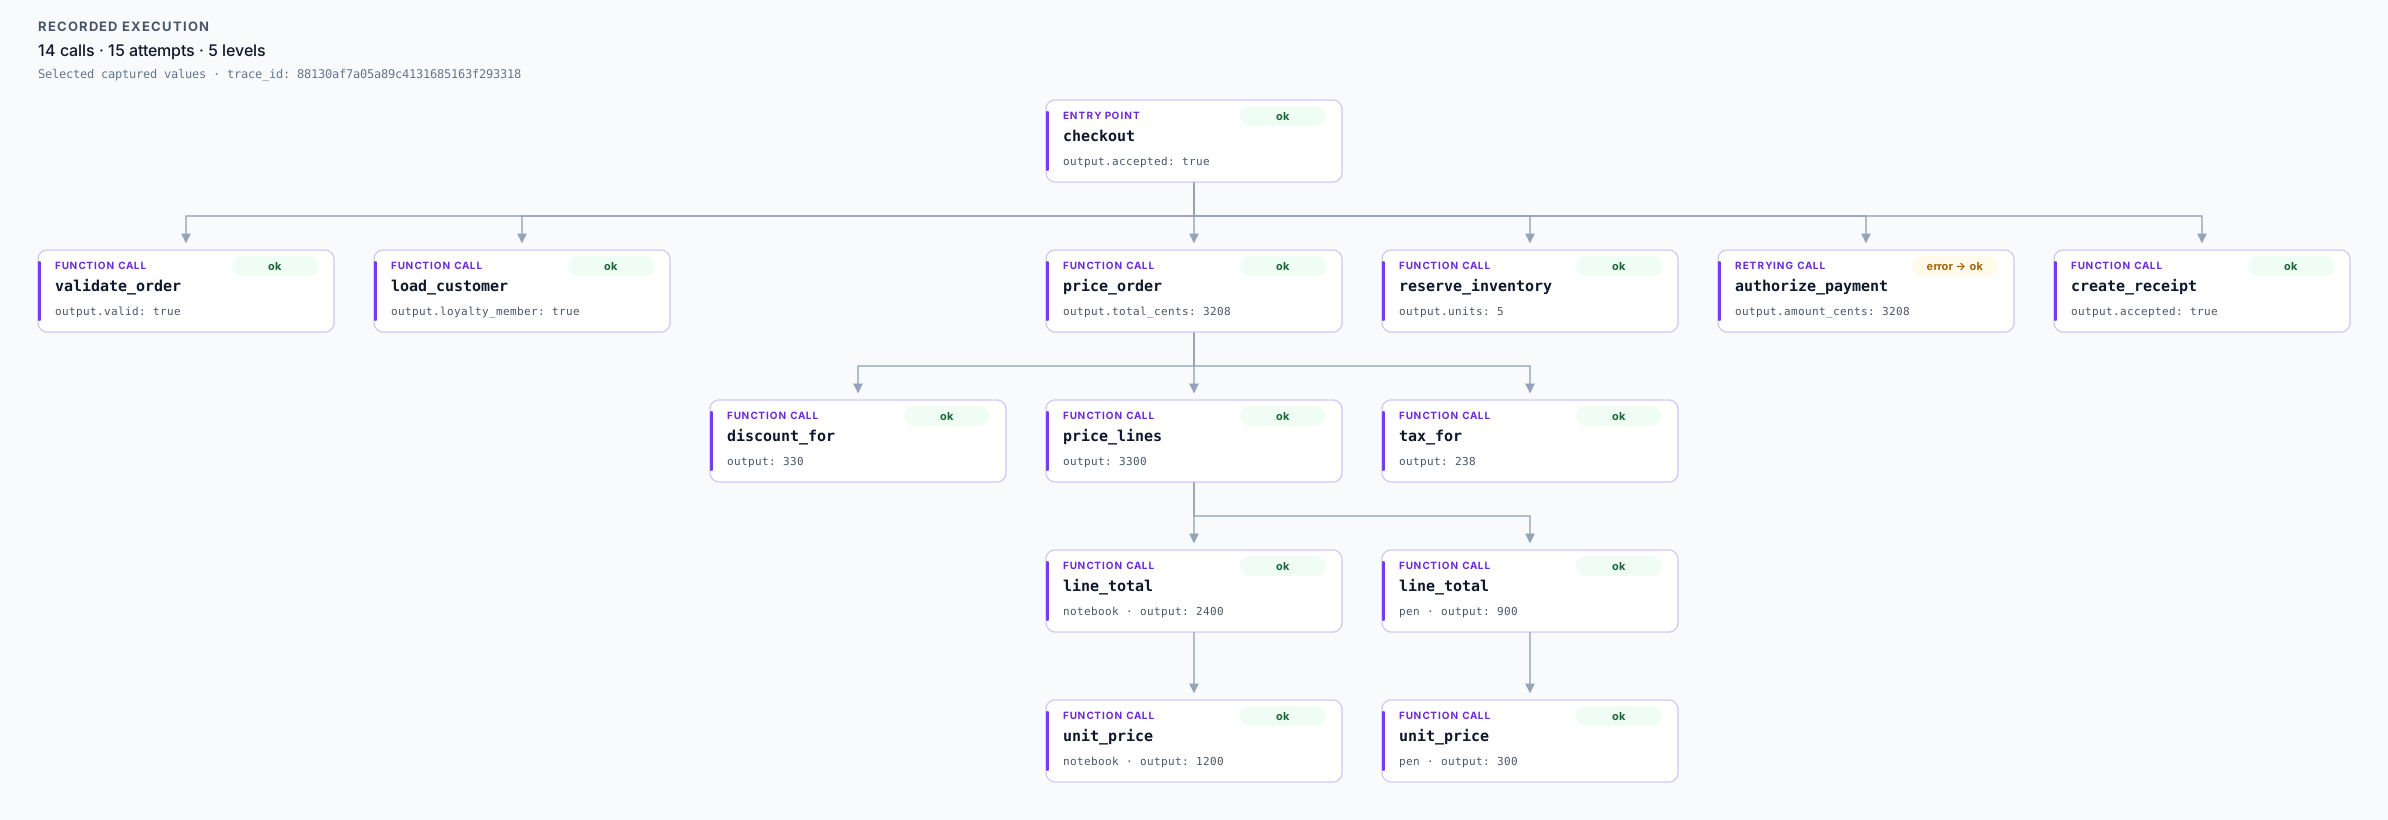
line_total nodes are distinct successful invocations, one per order item. The payment
node is one call with two attempts. Repeated function names alone do not establish retry
grouping. Use the attempts attached to the selected call.
Graph and Timeline can collapse many same-name siblings into a group. Select a group to expand
it. Table lists the recorded calls without that sibling grouping. A large recording can open
in Table automatically when its collapsed graph is too large; Graph remains available.
Read attempts and retries
Selecting a call initially selects its latest attempt. Graph color also follows the latest attempt, so a recovered call can appear successful while retaining an earlier failure. To inspect recovery:- Open Table and clear collapse retries to show individual attempts.
- Select the earlier failed attempt. Its Info, Input and Error tabs show the attempt’s status, timing and captured previews.
- Select the successful attempt to compare its status and output preview.
authorize_payment has attempt 0 with an error and attempt 1 with status ok.
The UI’s trace-value requests have no attempt selector, and their results have no attempt
identity.
Do not use fetched full values to compare numbered retry attempts. Status, timing and previews
are attempt-specific. Inspect recorded values explains
the retrieval boundary and the attempt-specific function-example alternative.
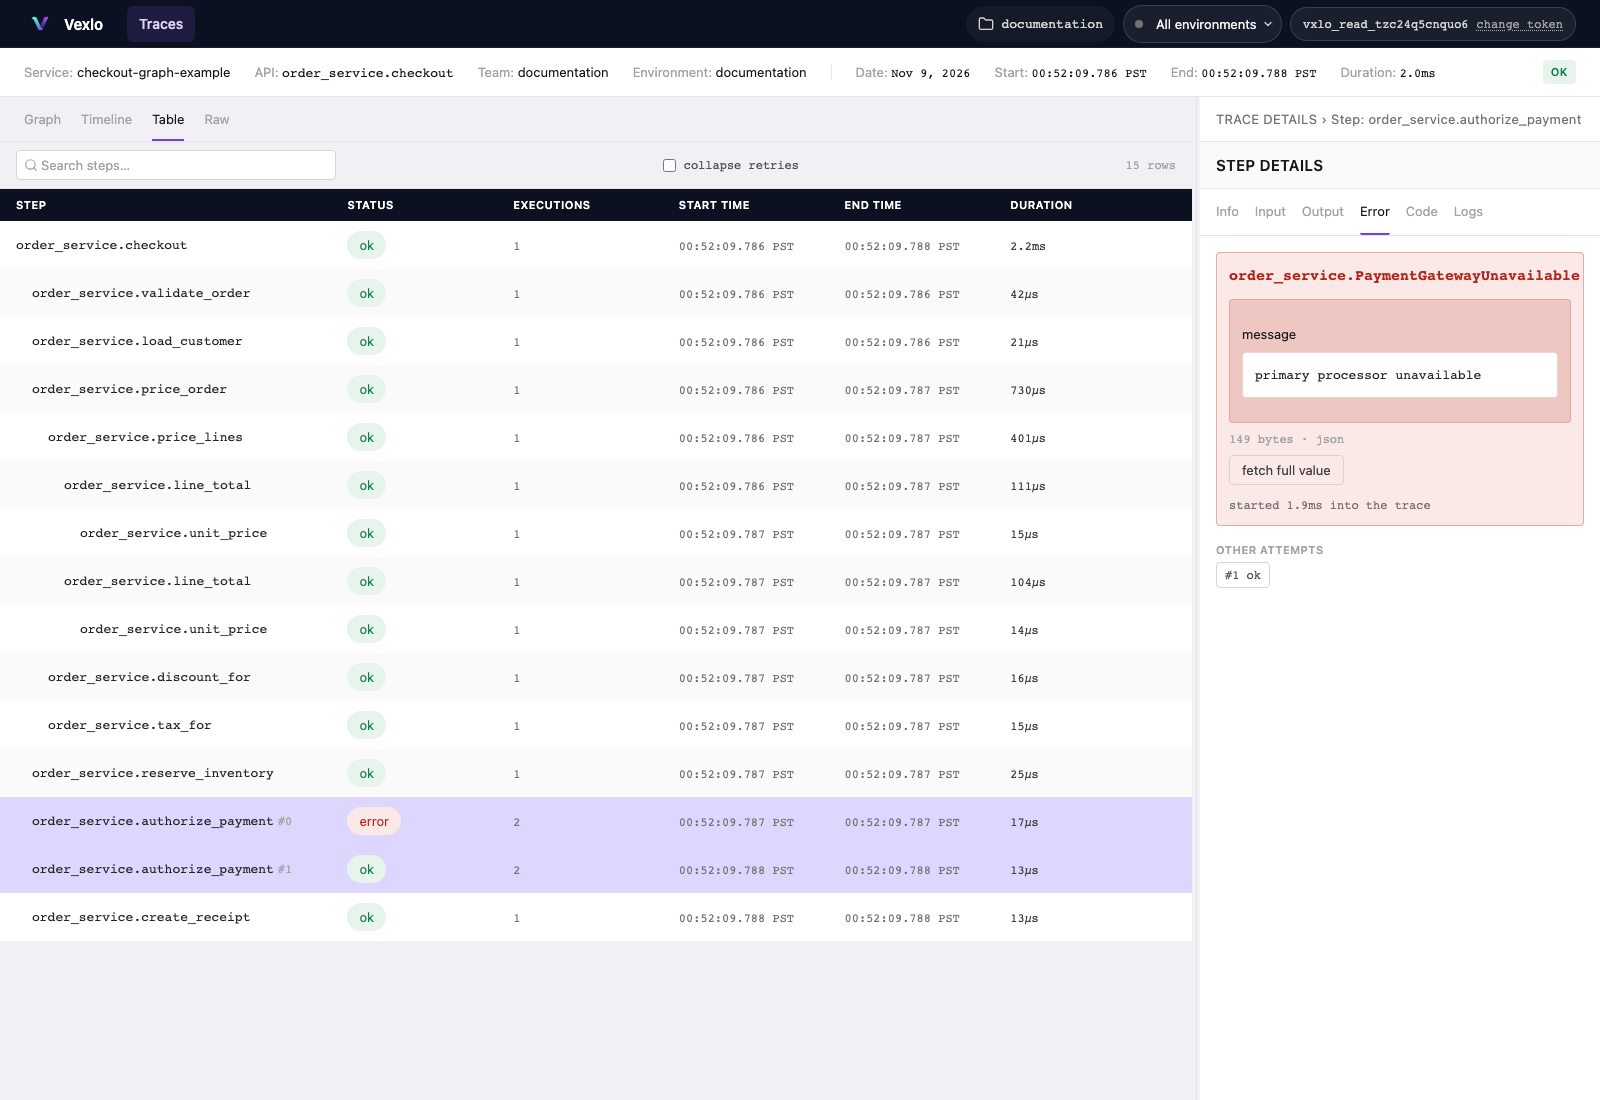
The failed payment attempt remains visible after recovery:
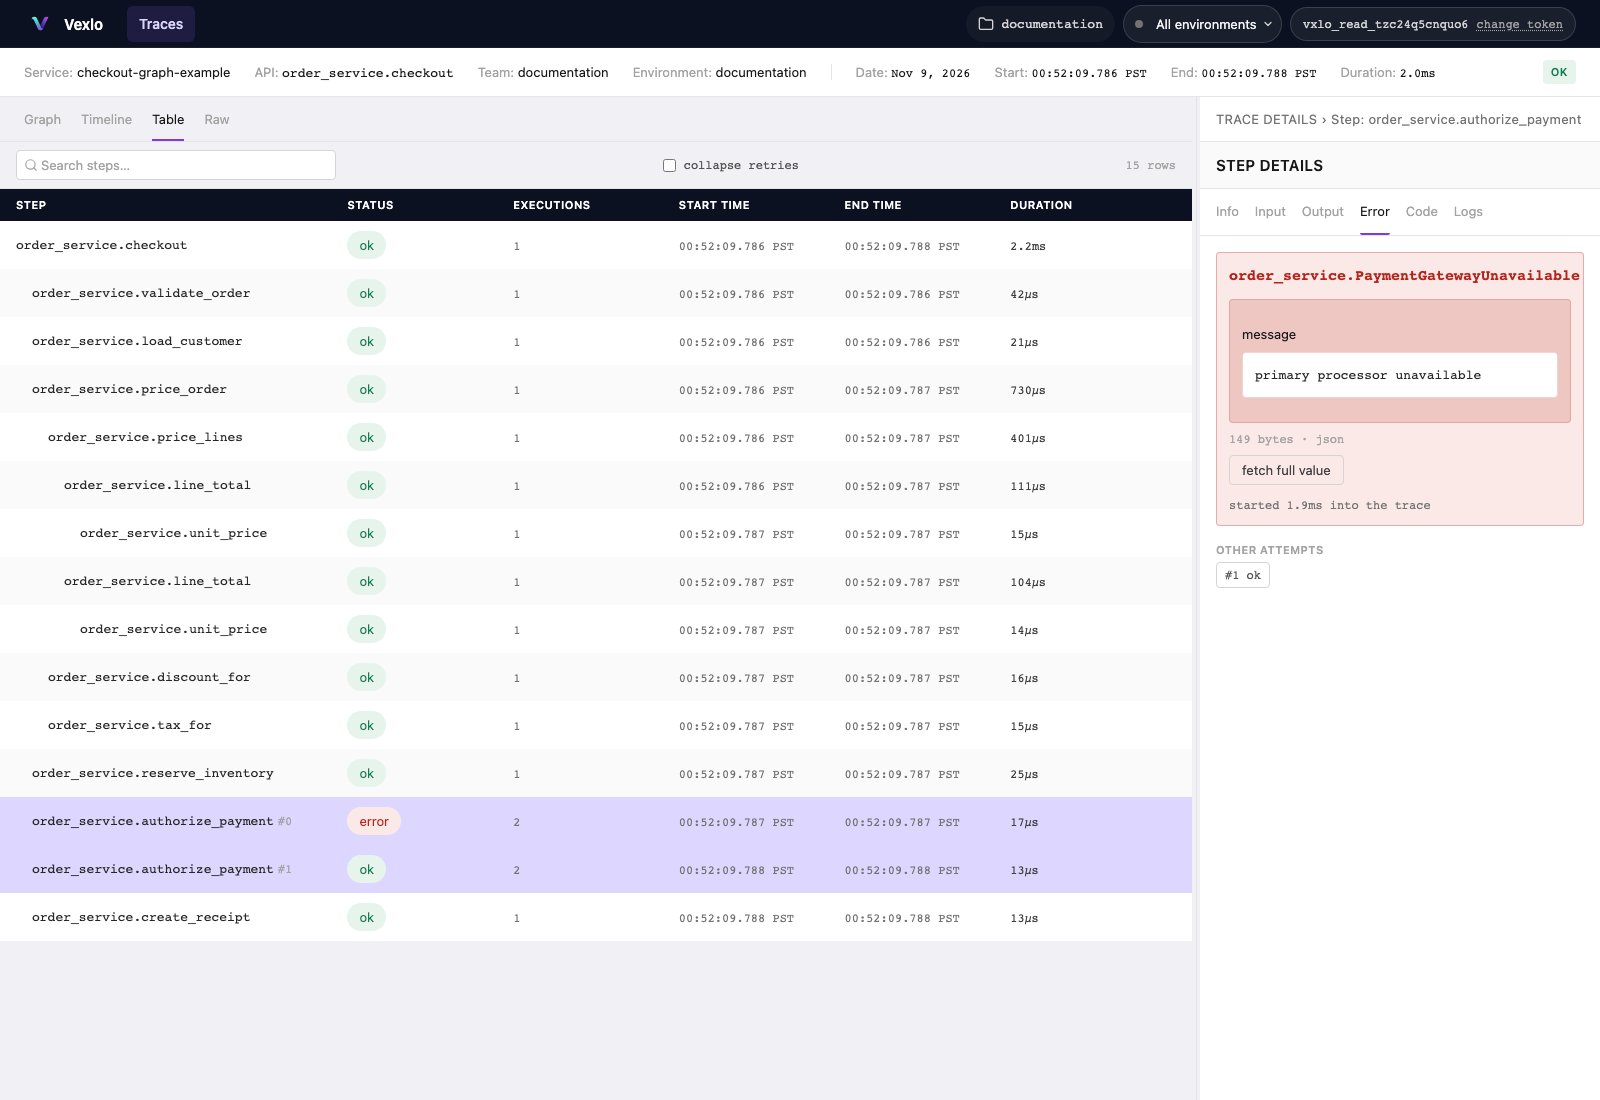
Table with retries expanded and the first payment attempt selected.
Analyze timing
Use Timeline to compare attempt start positions and elapsed durations relative to the trace start. Select a bar to inspect that attempt. Work that overlaps in time can occupy overlapping positions even though the graph lists its calls structurally. An attempt without a reported completion is drawn as a point, not as a measured duration. Use Duration in Table to sort the displayed attempts. The sort indicator identifies the current direction; put the longest completed attempts first when investigating latency. Attempts without a duration sort last. With collapse retries selected, a row shows the latest attempt rather than the combined time of all attempts.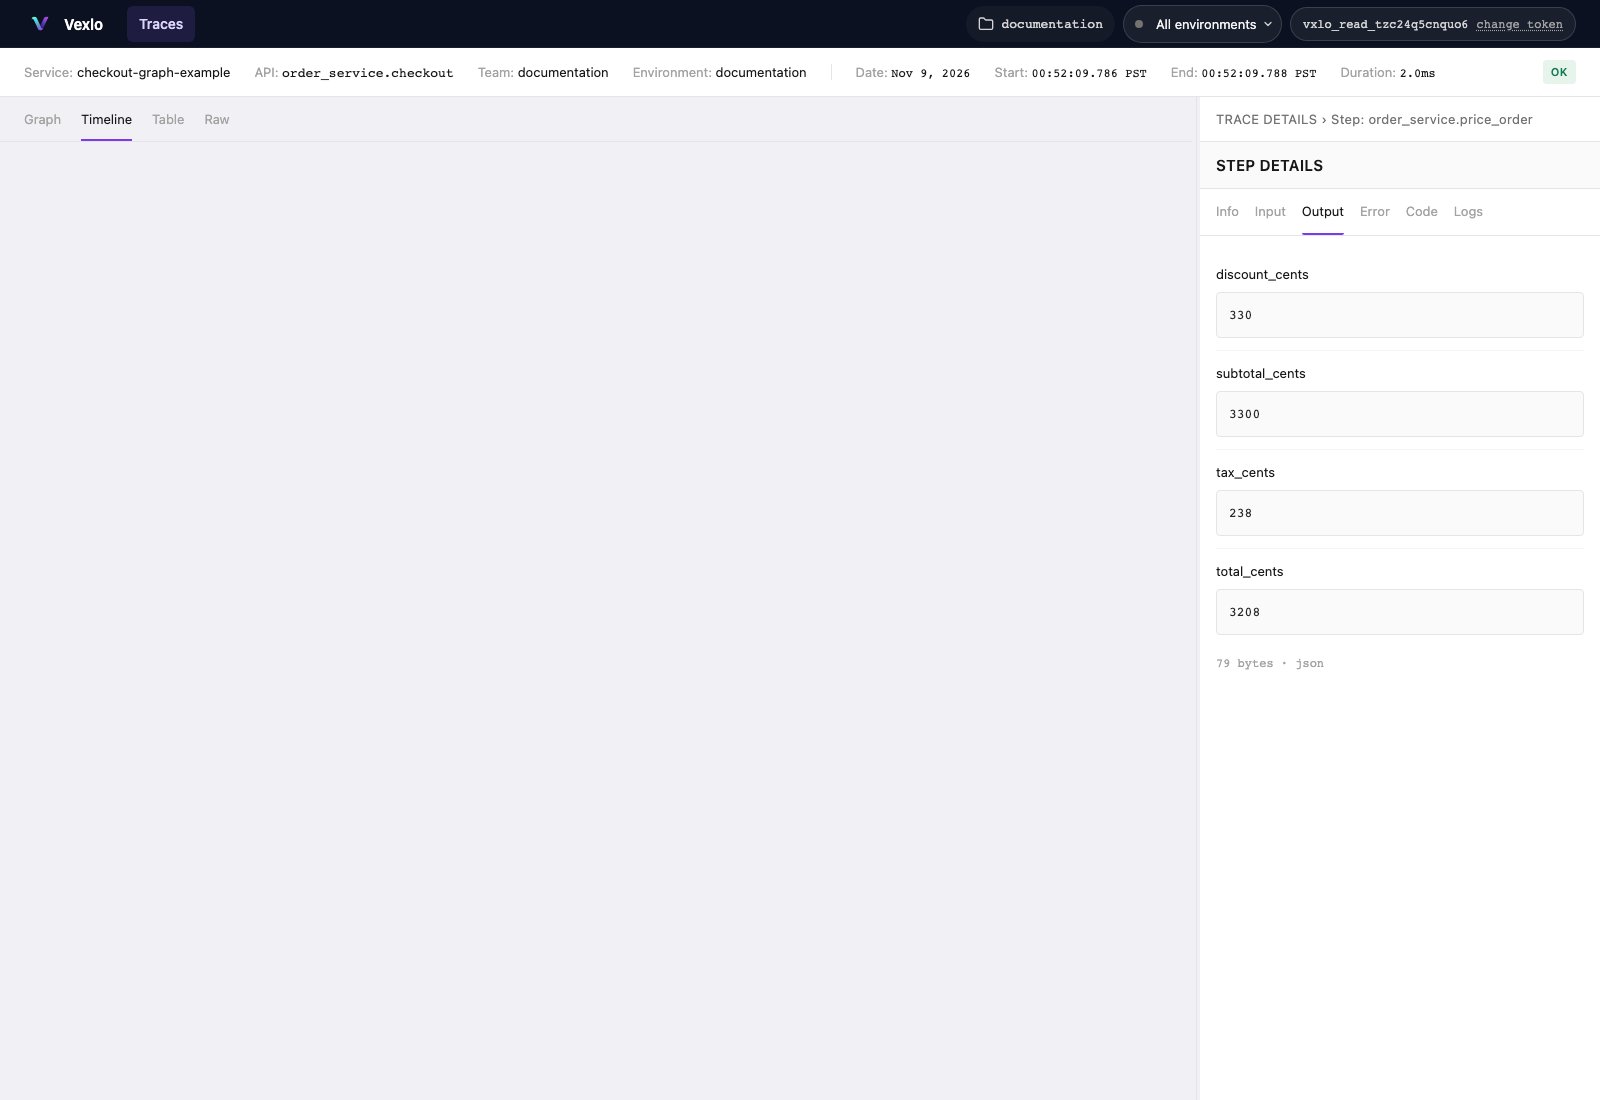
Timeline of the checkout with the pricing output open.
Inspect structure in Table and Raw
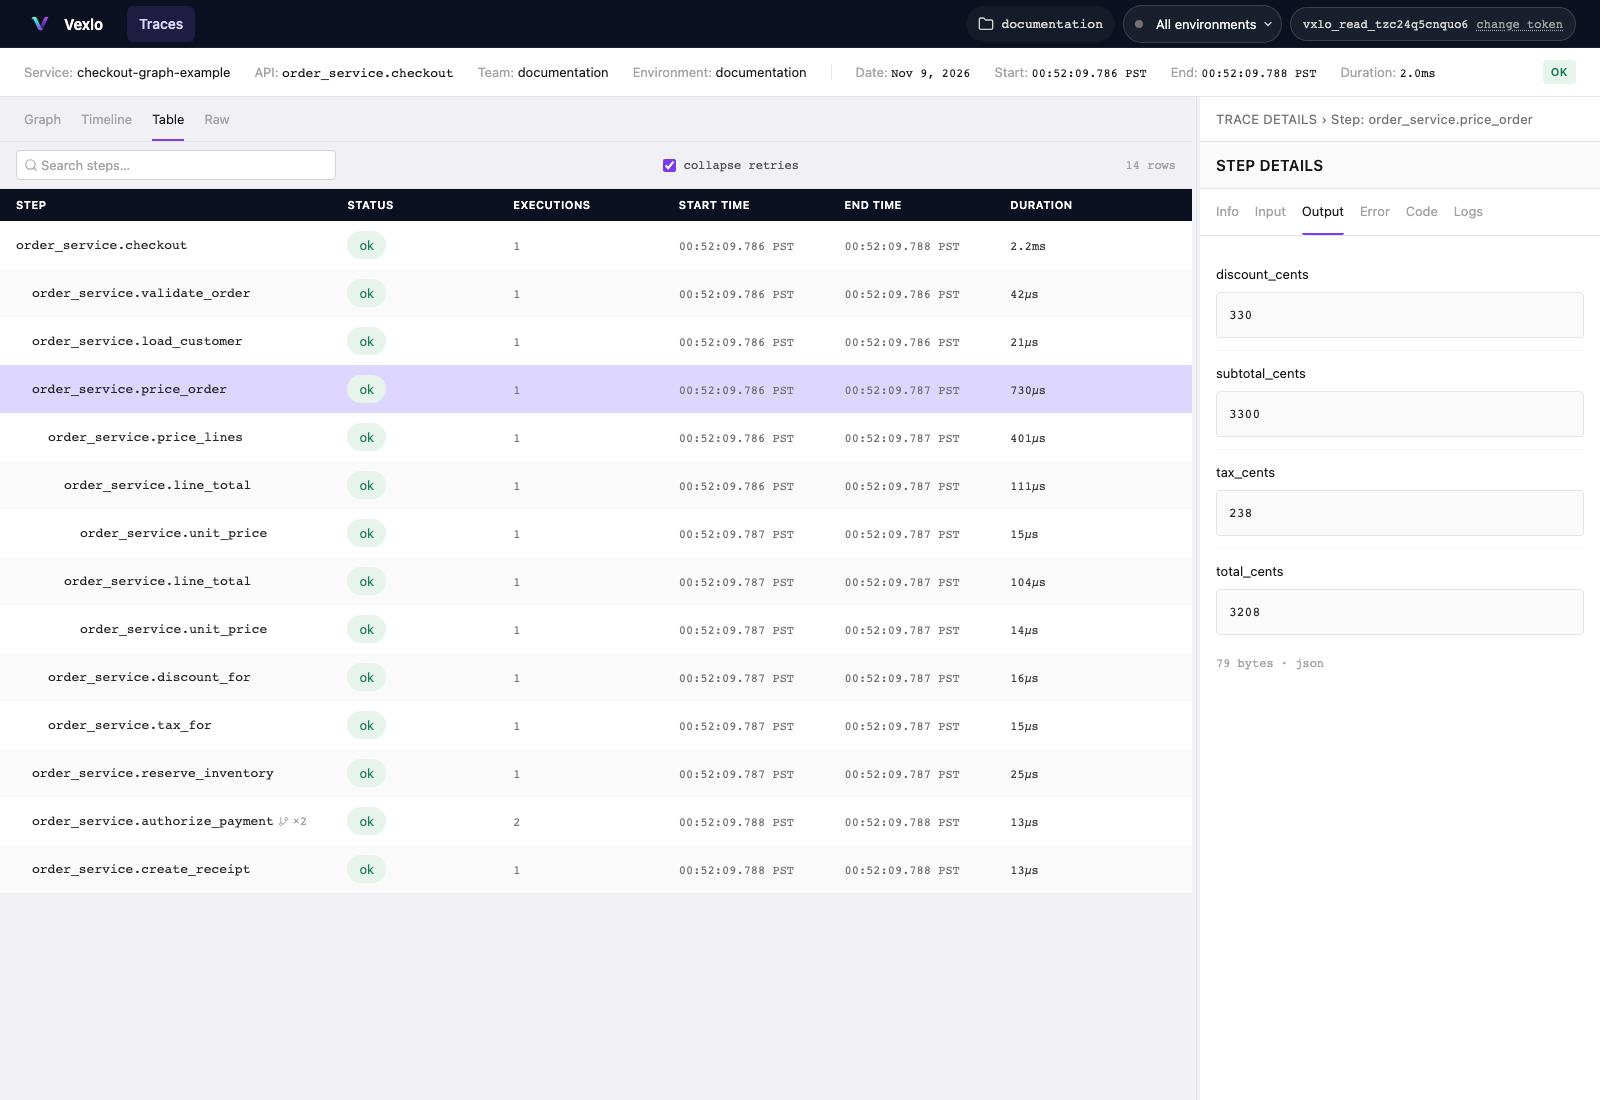
Use Search steps in Table to filter loaded calls by part of a function name. This is a local, case-insensitive substring search, unlike exact function matching in trace search. Select a row to inspect its call and attempt; focused rows also activate with Enter or Space. Raw shows formatted trace JSON. Values fetched in this session are merged into the corresponding displayed slots and markedclientFetched: true. Use copy JSON or
download JSON to export that displayed data. Raw does not fetch all values automatically,
and its merged retry values retain the full-value attempt limitation described above.
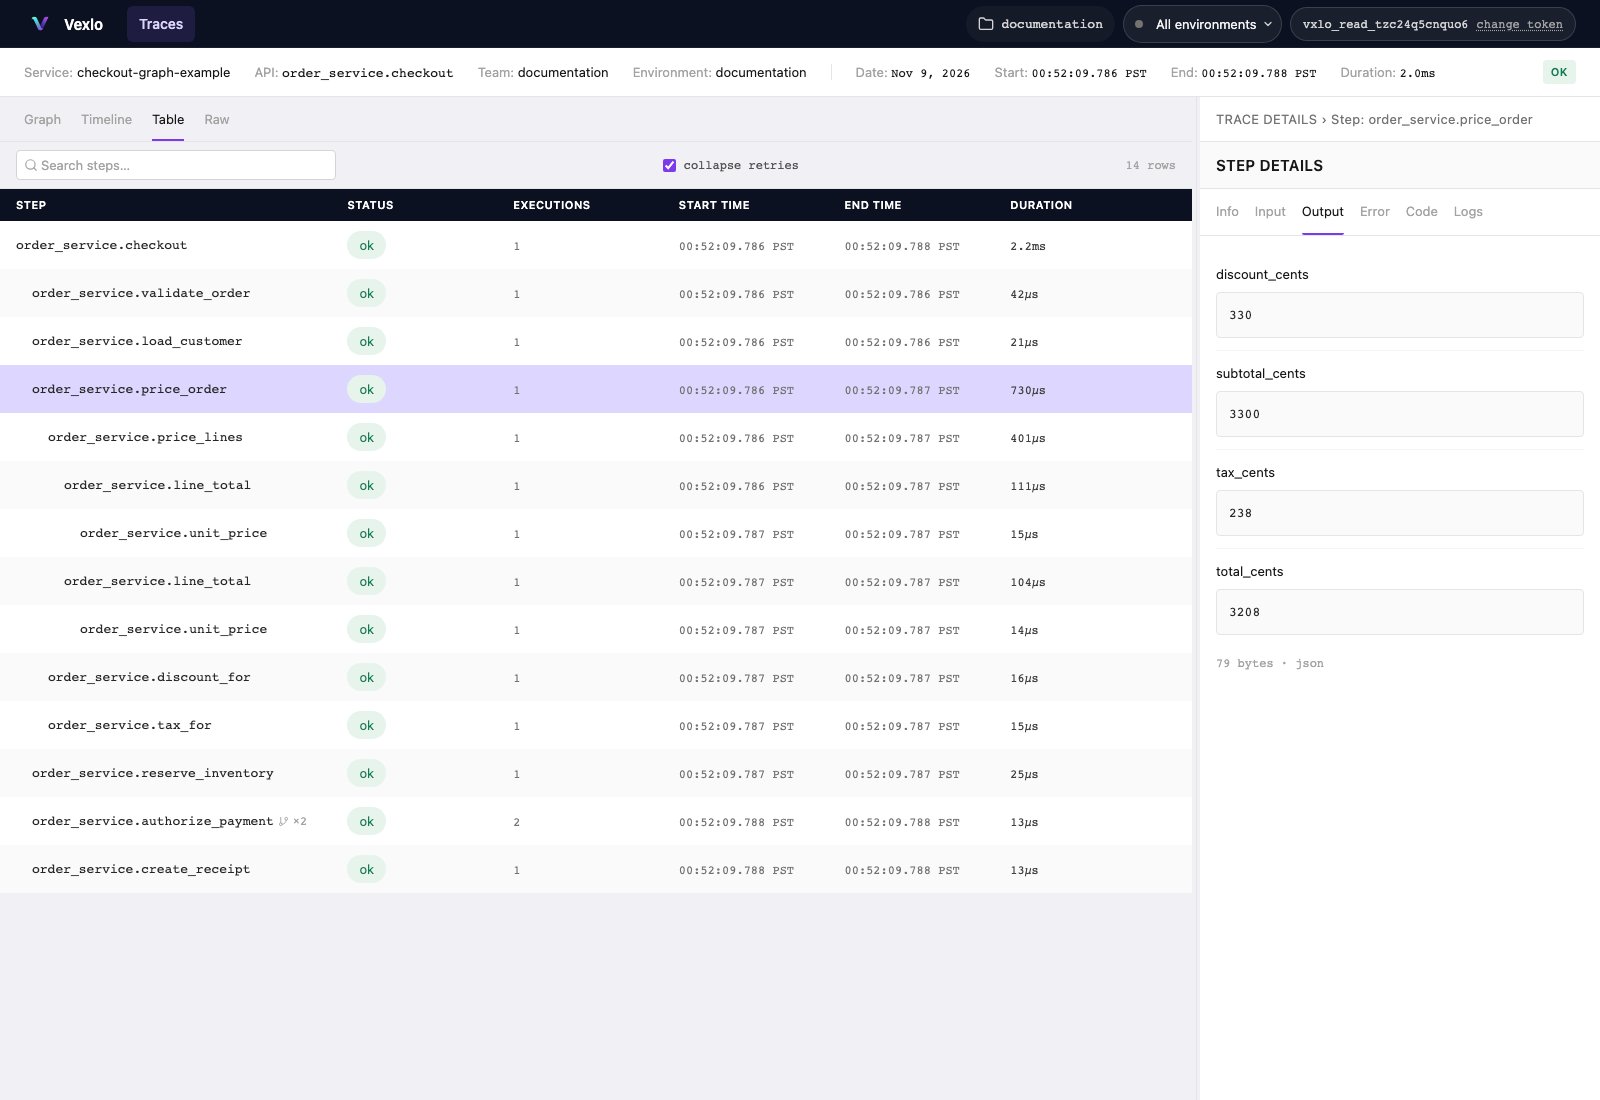
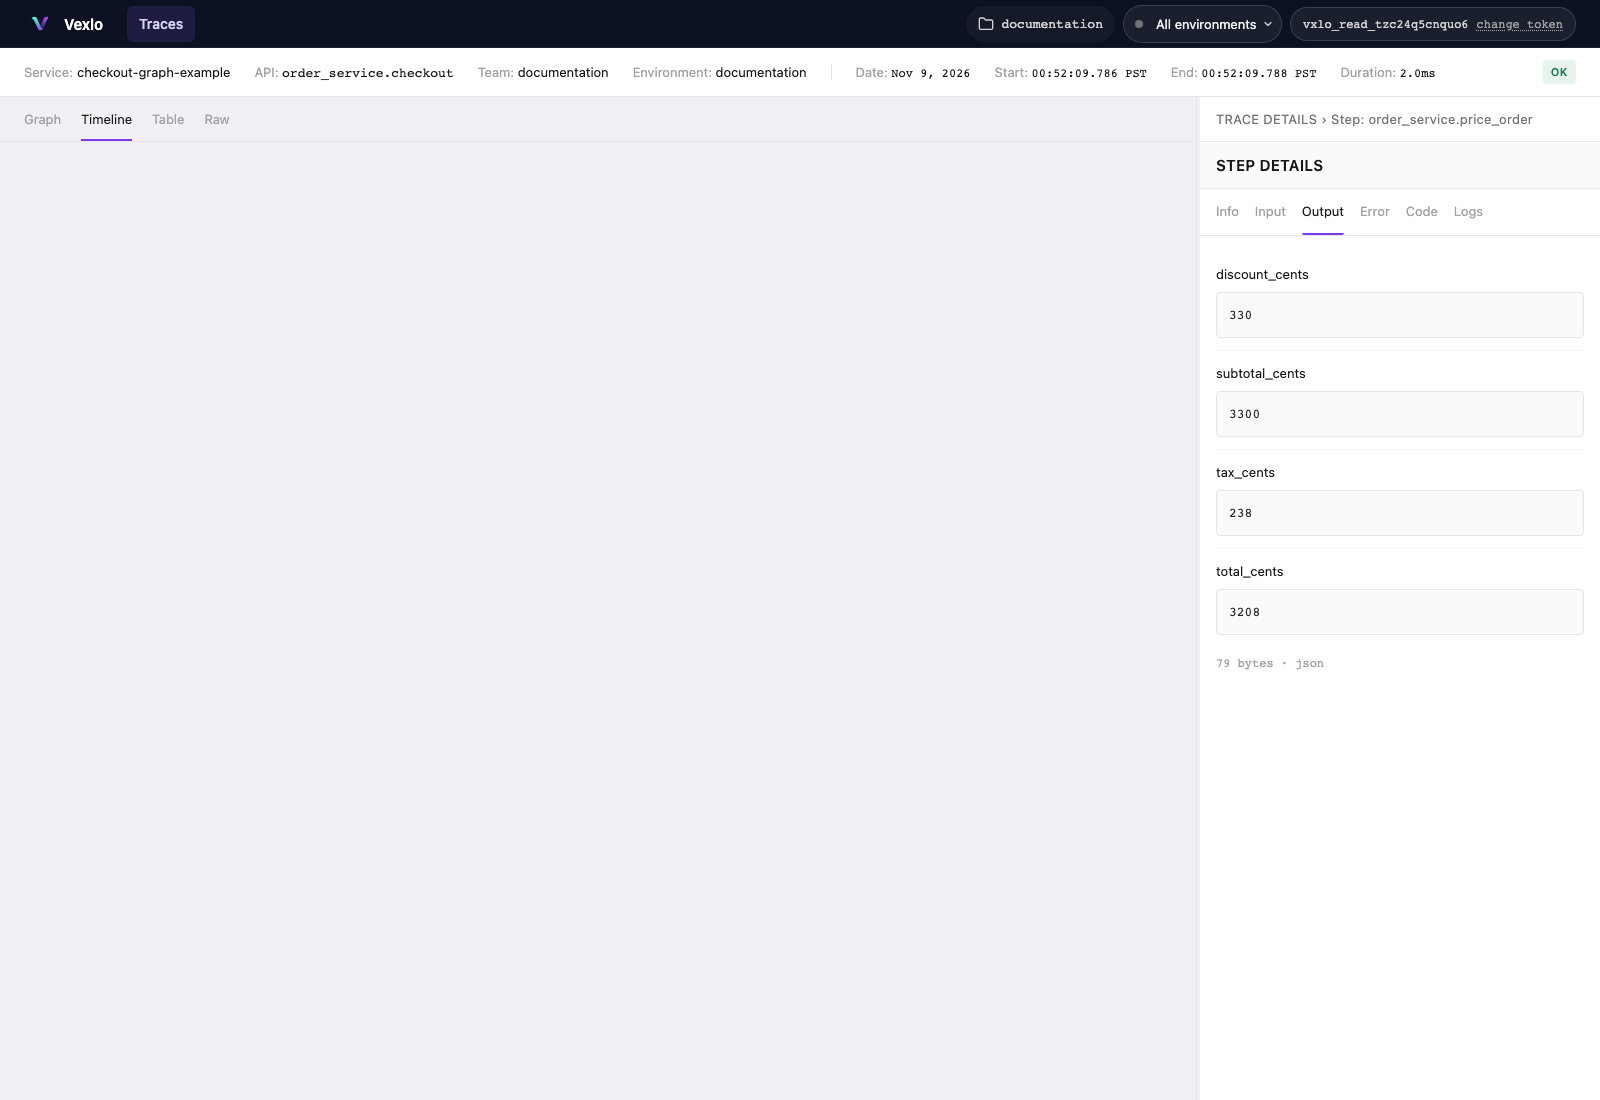
Table view of the checkout recording, with pricing selected and its output loaded.