Connect and choose scope
- Open the Vexlo server URL. If a connection screen appears, enter a read token in Read token and select Connect. An ingest token is rejected.
- Select Traces in the application bar.
- Choose the relevant team. A token covering one team displays its name; a token covering several teams offers a selector, including All my teams.
- Choose the deployment in Environment. Unset selects records with no environment label; All environments removes that environment restriction.
Find an execution by identifier
On the home screen, enter a trace ID to open that recording directly. The UI recognizes a 32-character lowercase hexadecimal trace ID. Other text becomes a search across tag values. For example, enteringorder-1042 searches recordings tagged with that identifier, regardless
of which tag key carries it. Select Search to continue.
Use an identifier from your own recorded request. In the checkout example used in
The execution graph, the entry point records
order_id=order-1042. This tag identifies the request; it is not the trace ID.
If you know only the service or function, select Show All Traces from the home screen, then
use Service, Root function or Function anywhere in the filter rail. A function
filter matches the full function name. Its autocomplete offers names from observed execution.
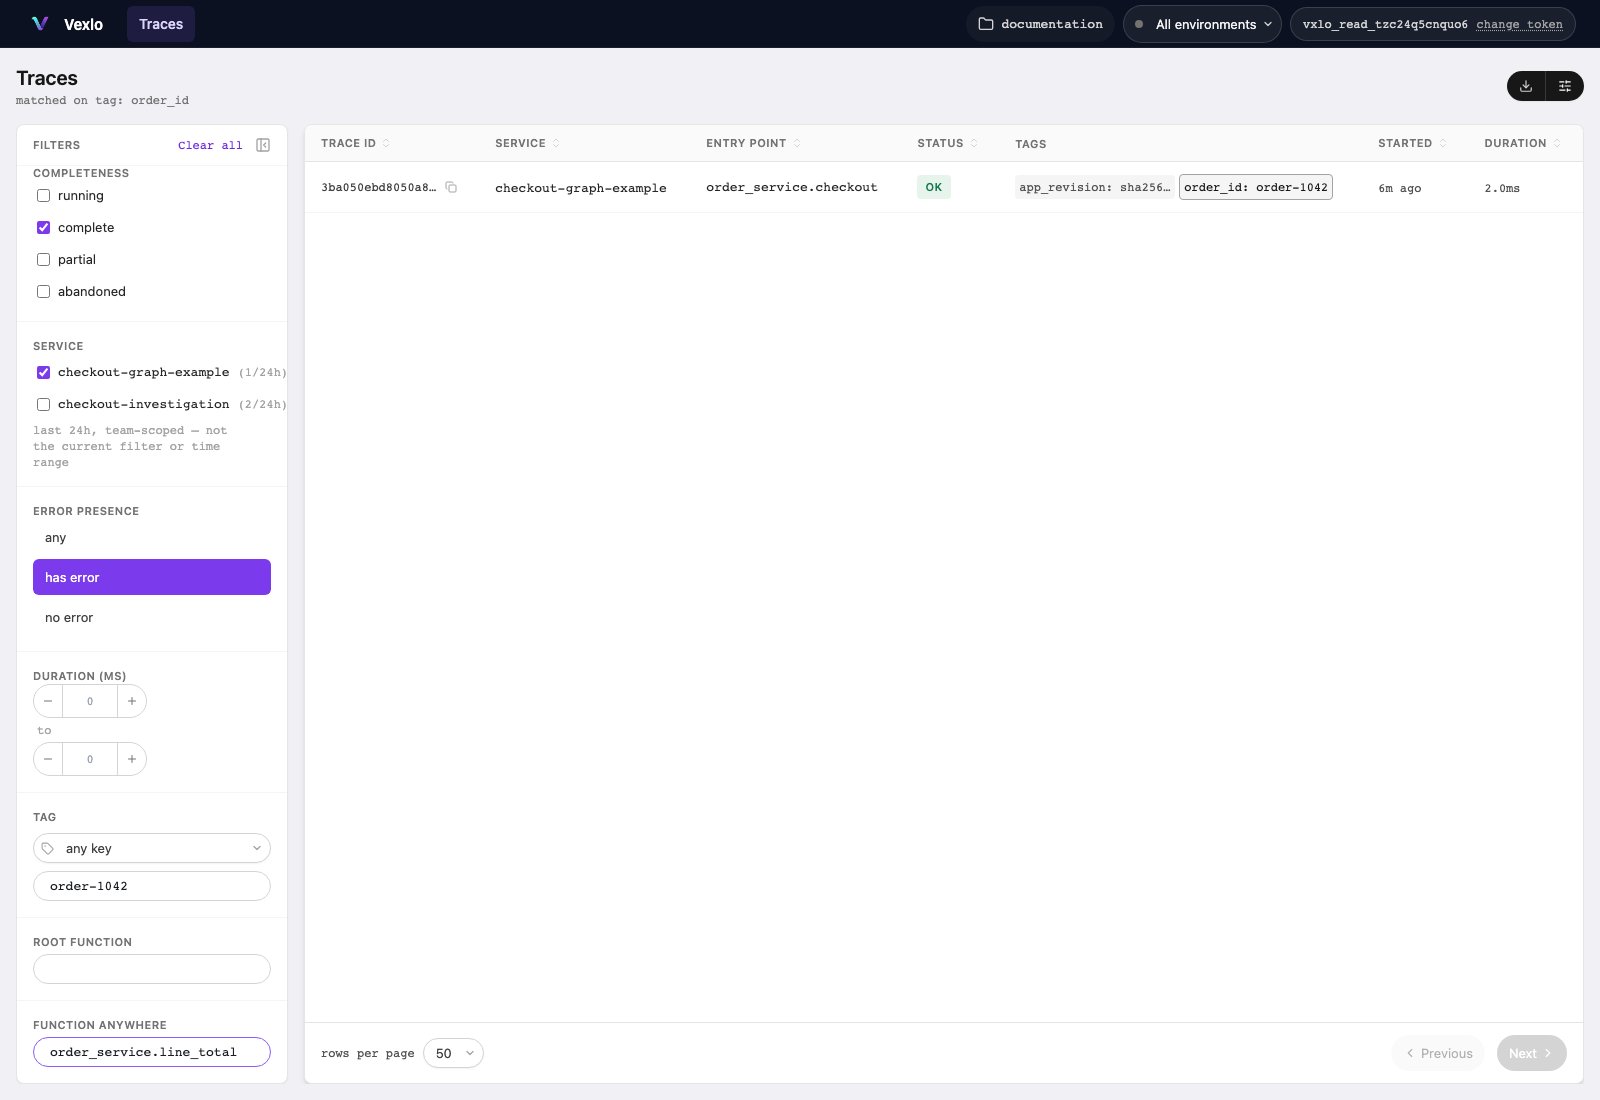
Filter recordings by an exact function name.
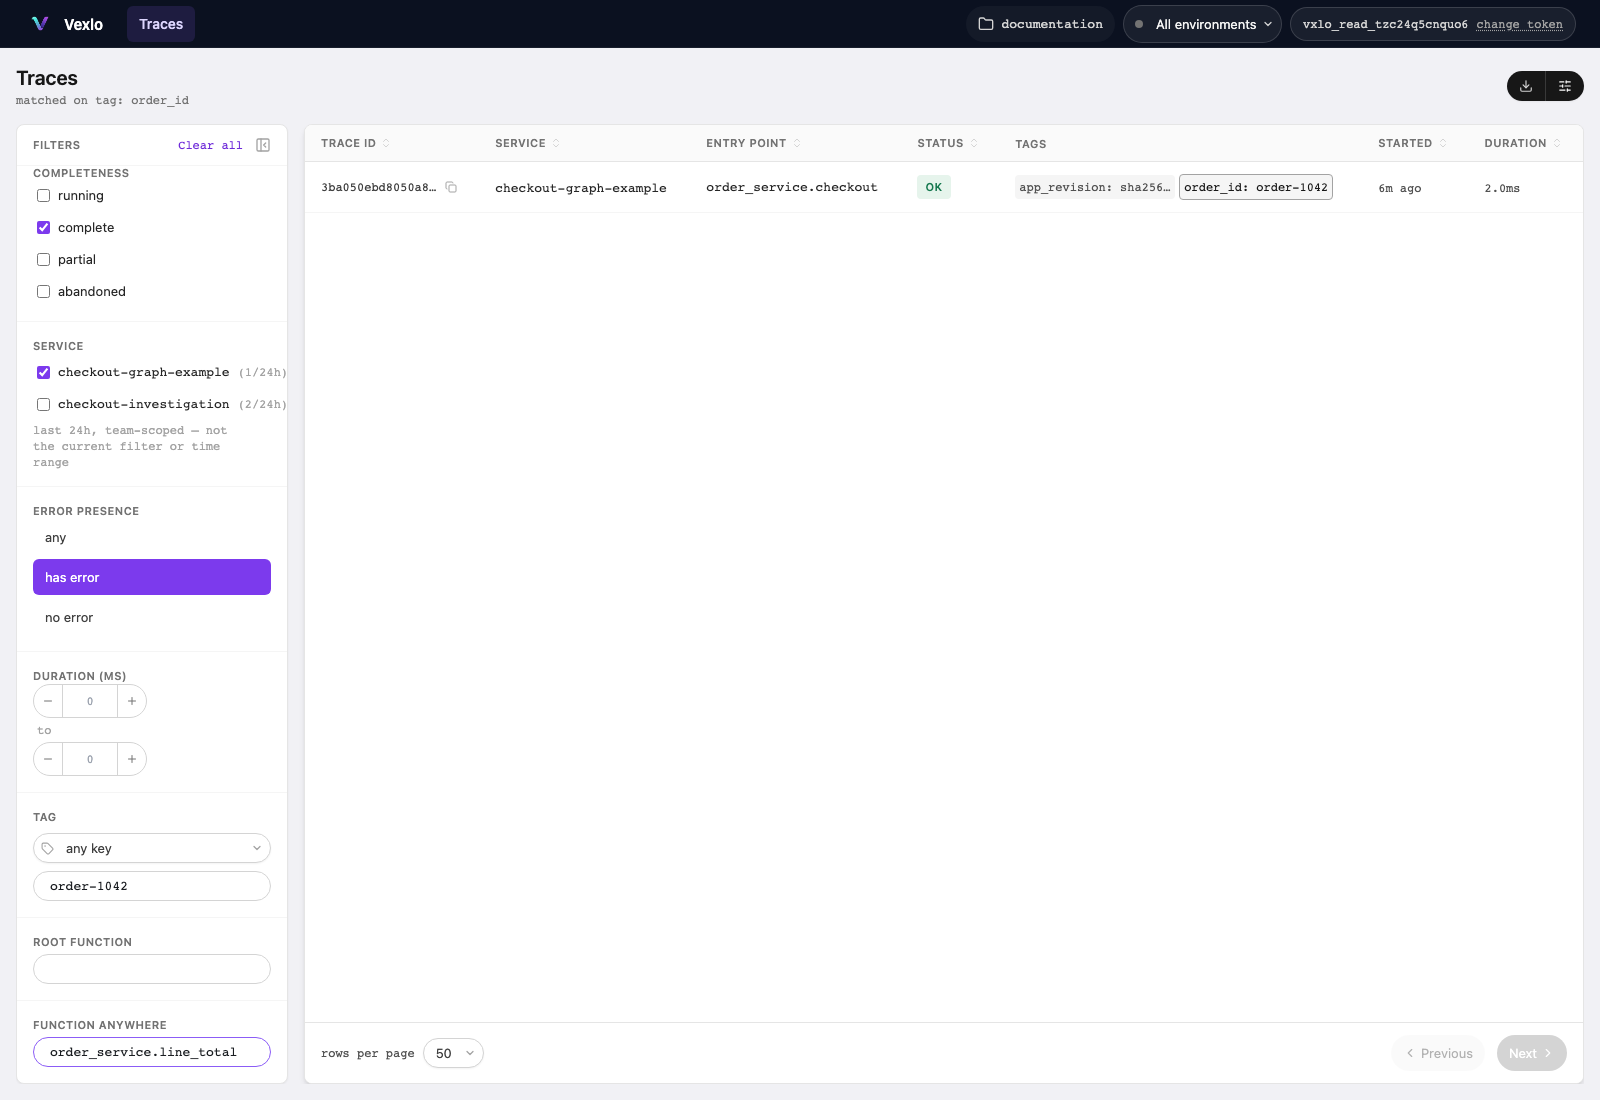
Filter recorded executions
Choose a time range and service before adding more specific conditions. Filter changes rerun the search and return to its first page.
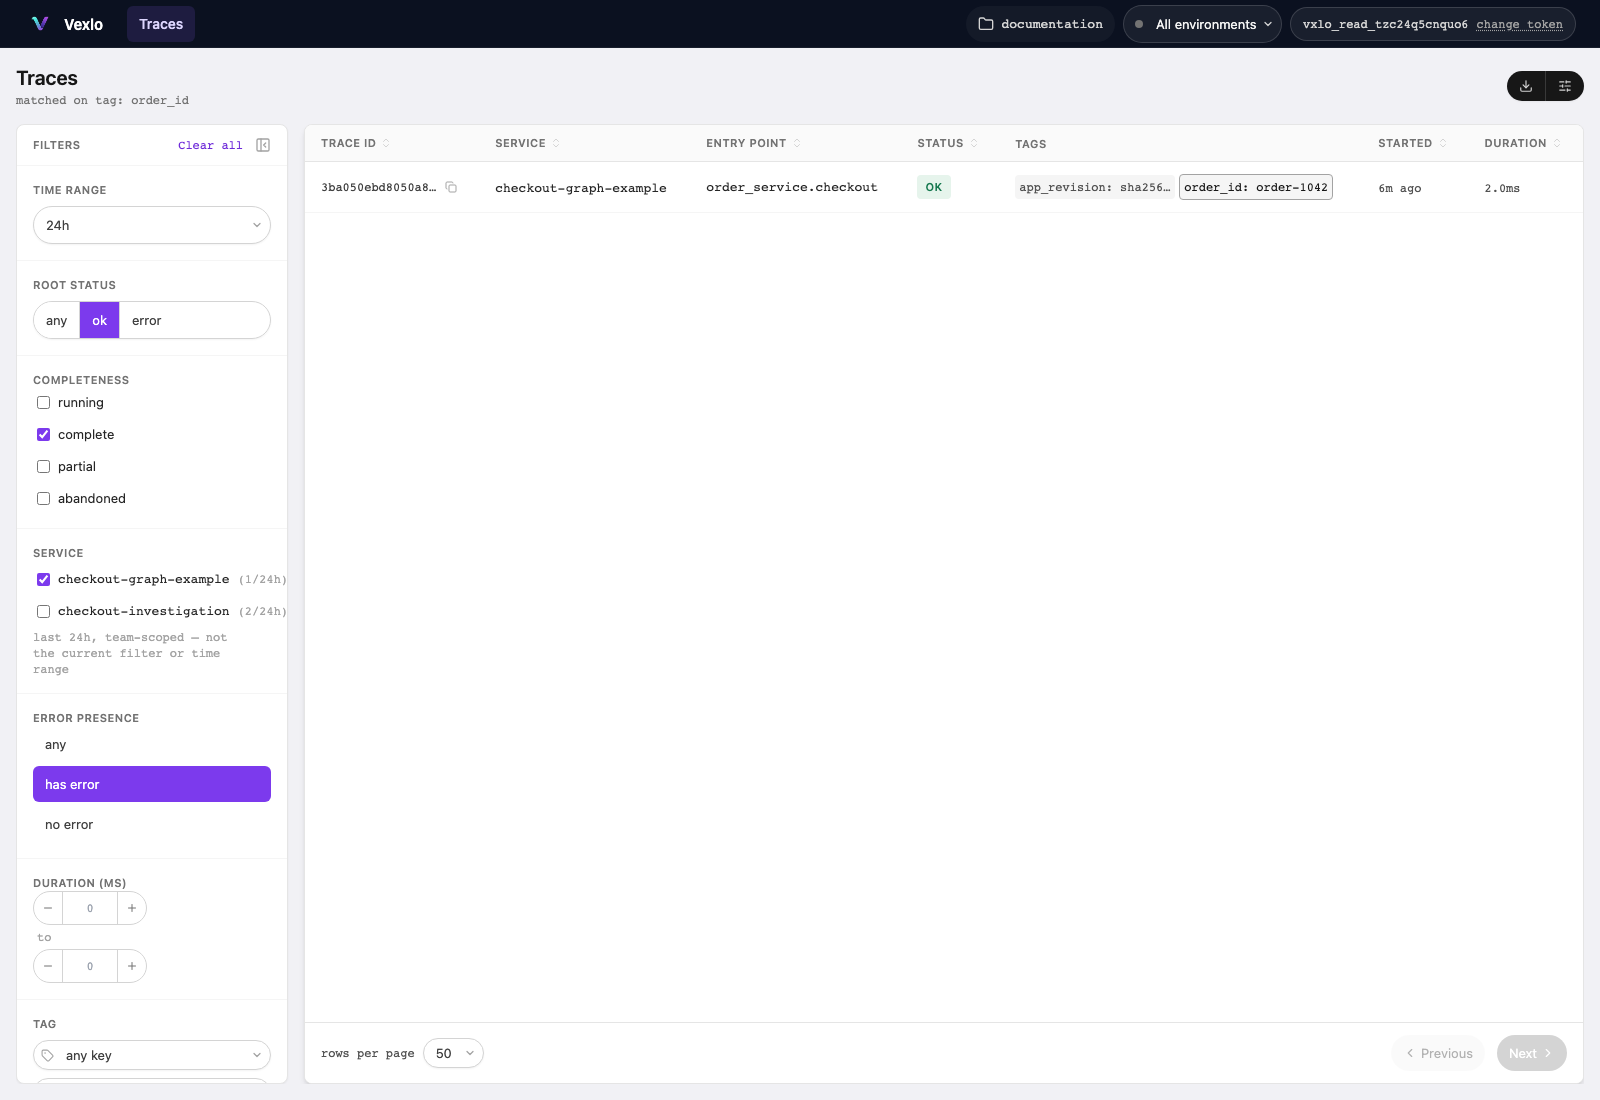
The fuller checkout in Explore execution graphs returns normally
even though its first payment attempt fails. A search
with Root status set to error excludes it. Error presence: has error includes it.
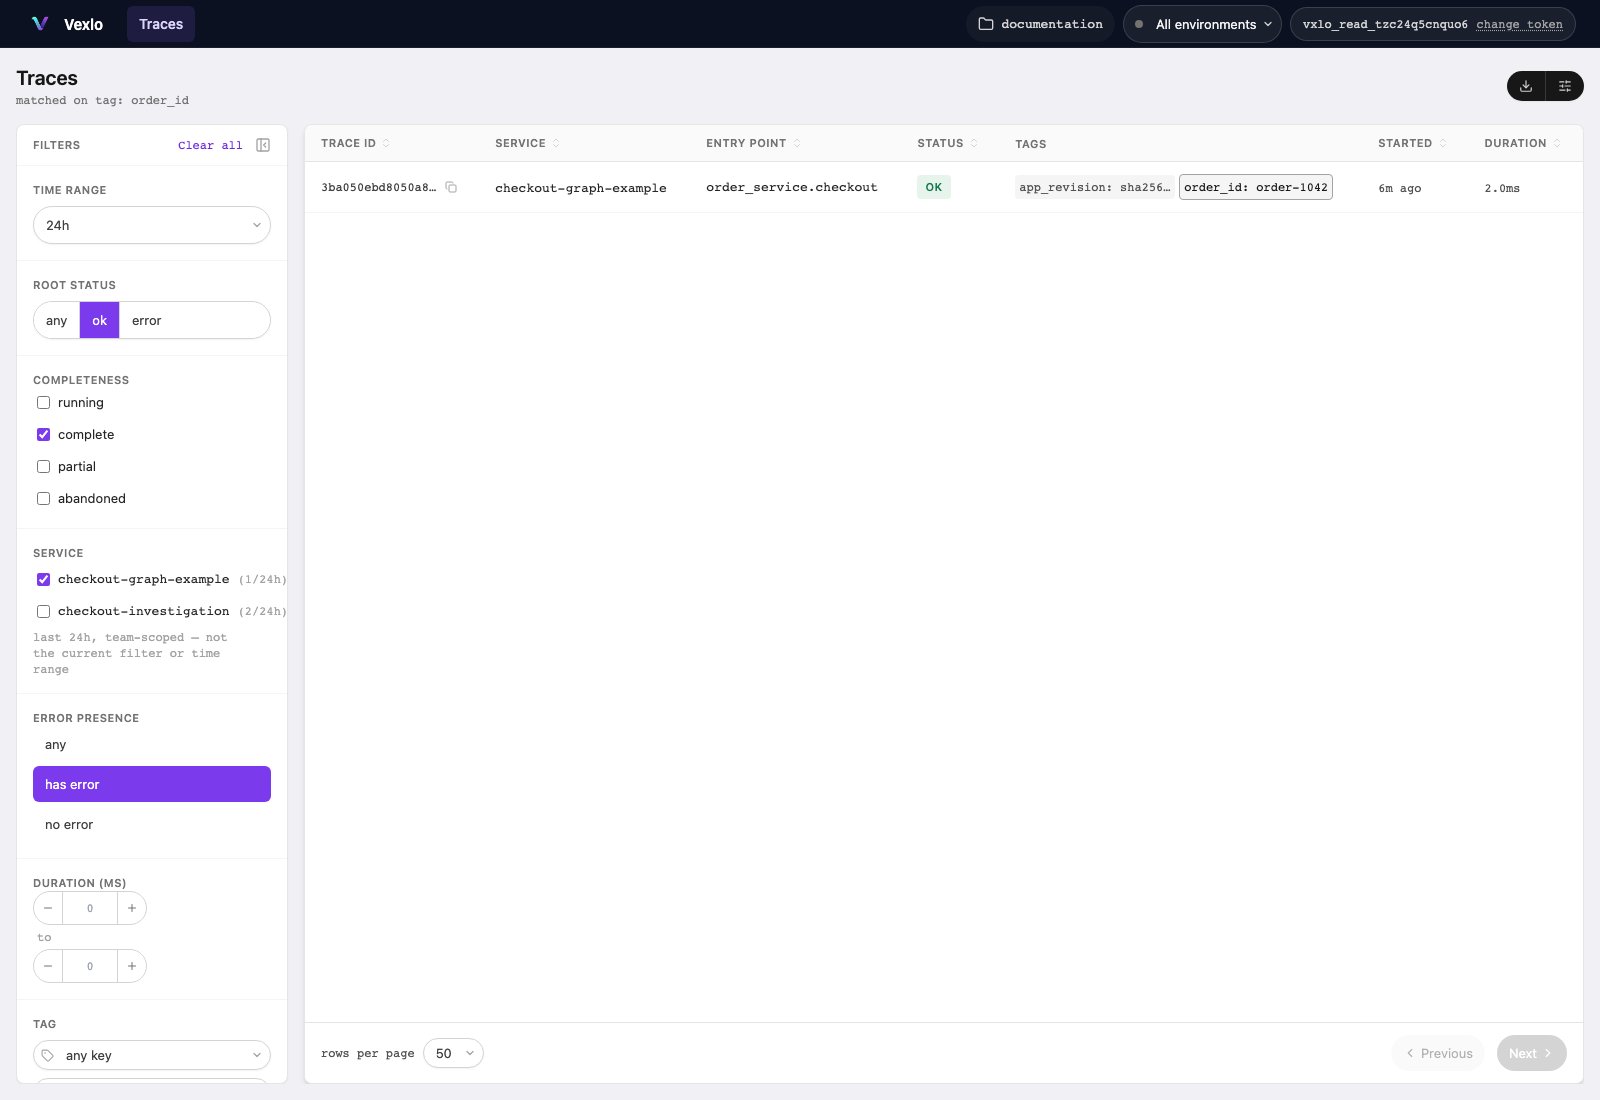
A normally returned checkout that contains a recovered payment error.
Work with search results
Results include Trace ID, Service, Entry point, Status, Tags, Started and Duration. The server orders trace search by last-seen time, newest first. Selecting a sortable column changes the order of the current page only; it does not globally reorder all matching traces. The primary status badge shows the root result when it is available. Before the root completion arrives, it showsrunning or abandoned. Recording loss has a separate coverage
indicator, so an ok badge alone does not establish a complete recording.
- Open a result by selecting its row. A focused row also opens with Enter or Space. The copy icon beside the trace ID copies the ID without opening the trace.
- Use Next, Previous and rows per page to navigate results.
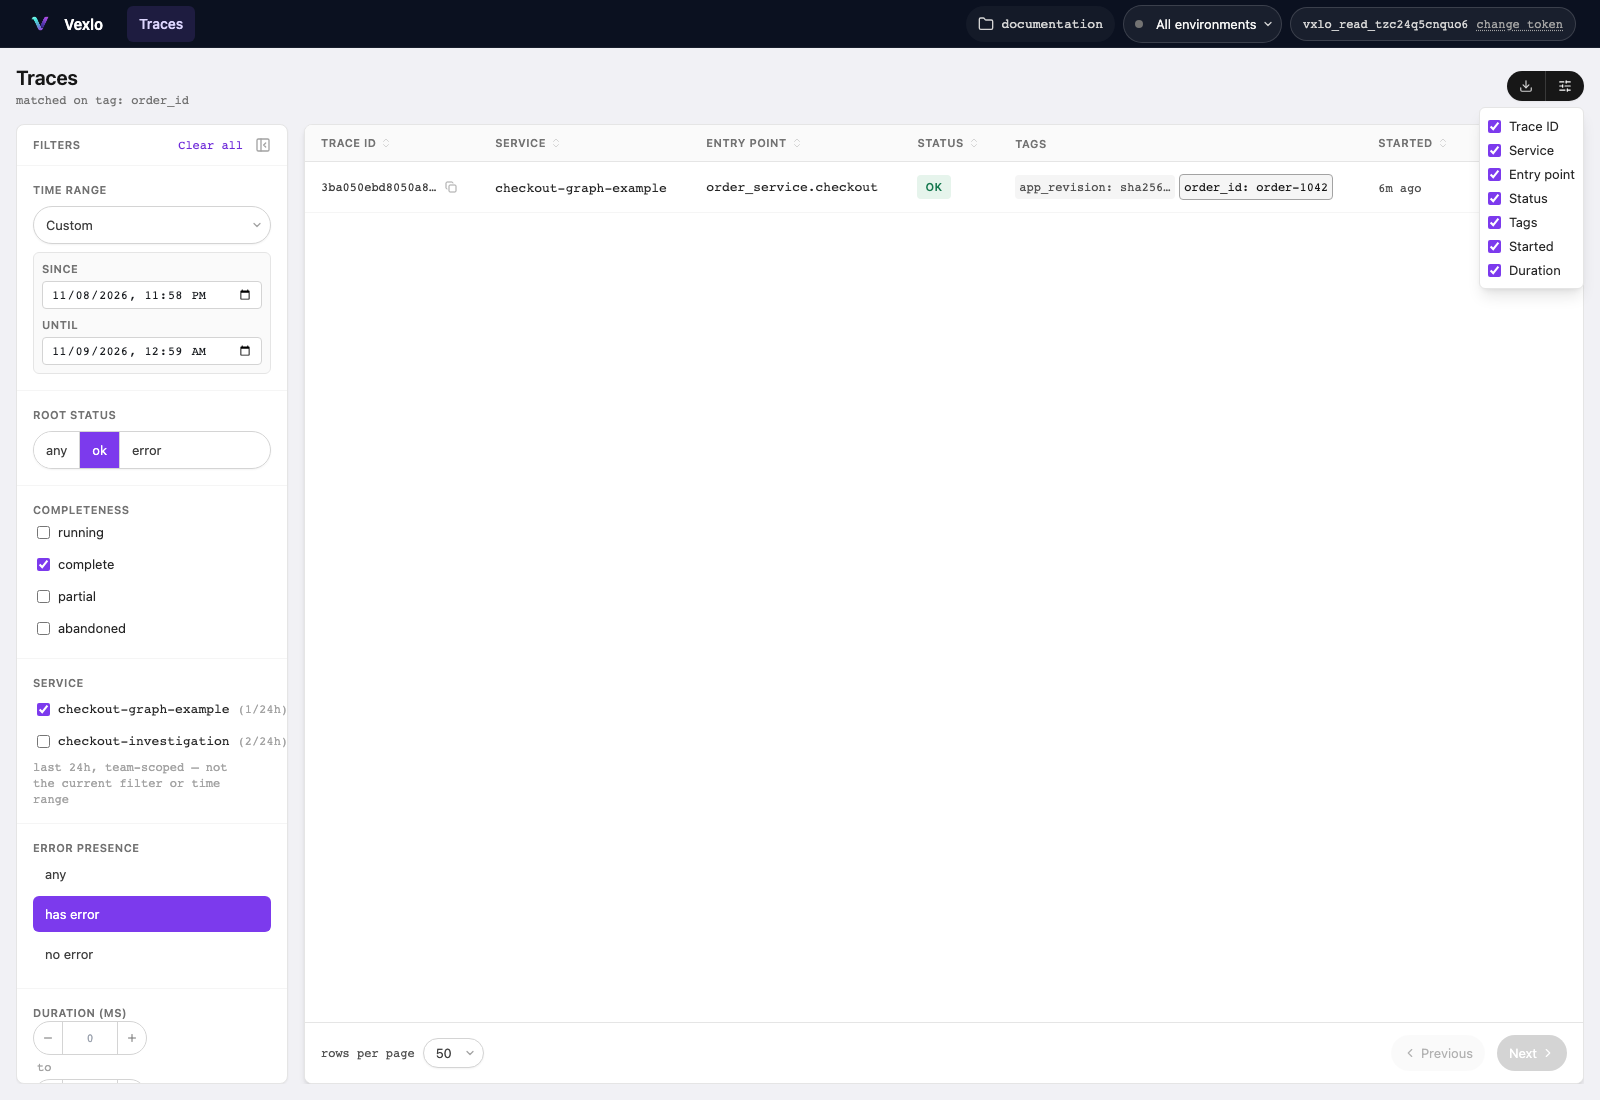
- Use the Column visibility icon beside the download control to choose visible columns.
- Use Download this page, then Download as CSV or Download as JSON, to export the current page’s trace summaries. Export does not fetch all matching results or full traces.
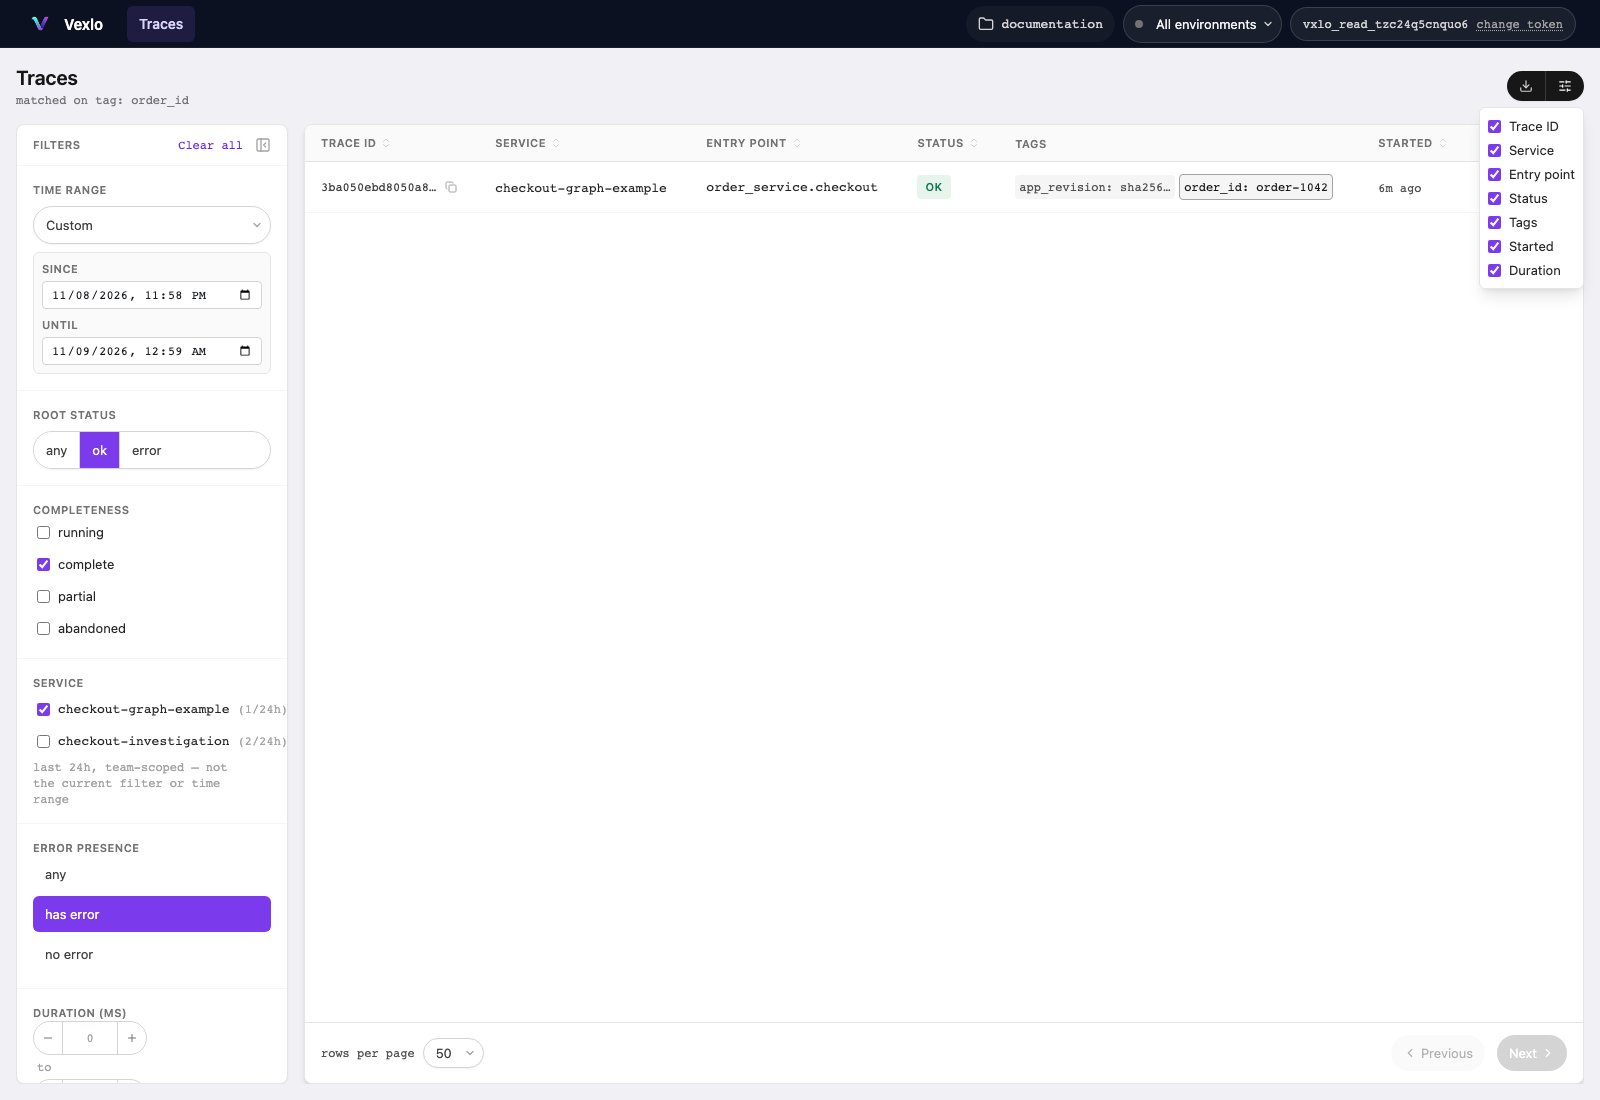
Custom time bounds and the Column visibility menu.