
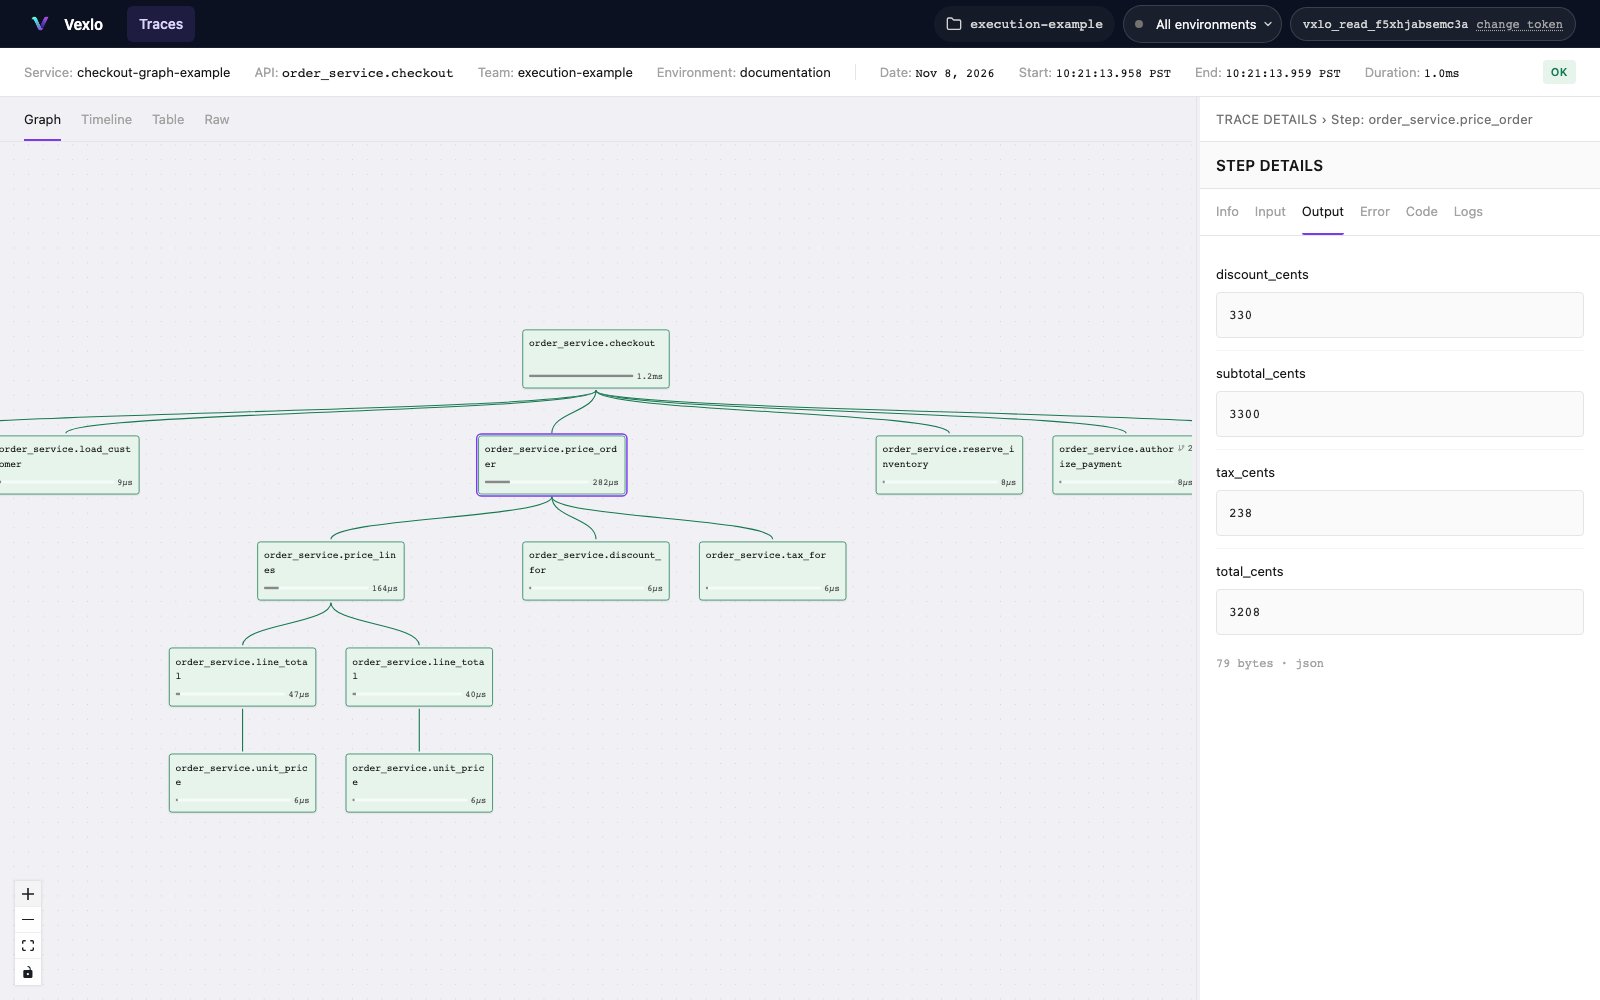
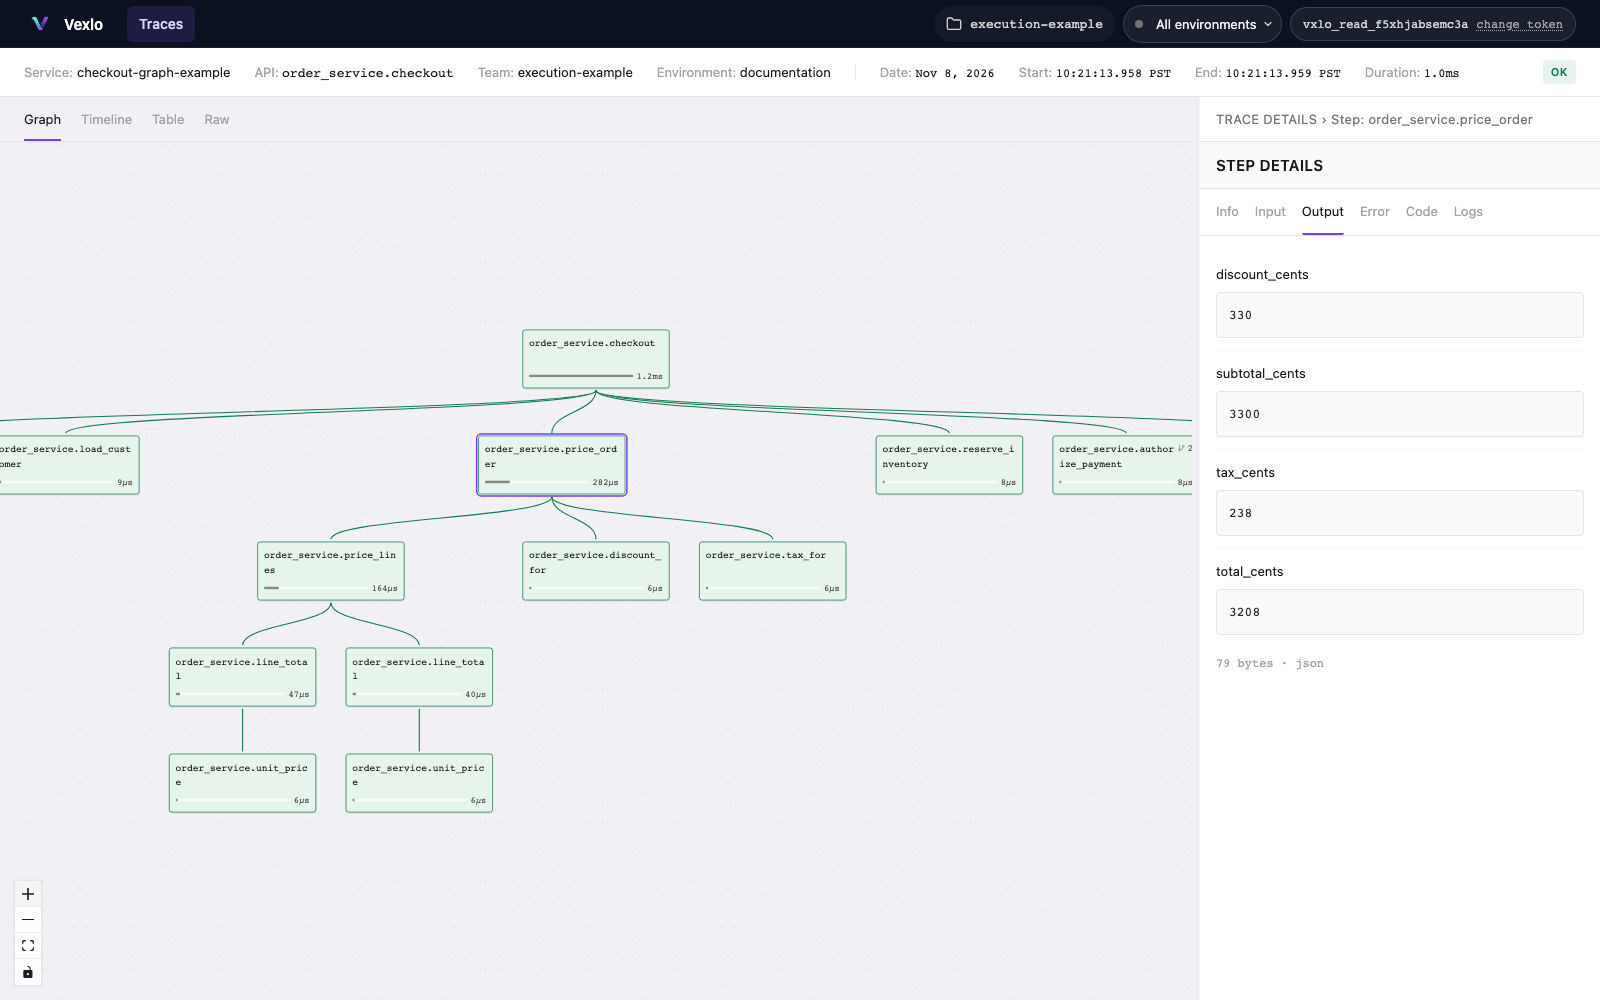
Graph view with price_order selected and its recorded output loaded.
Connect to an instance
You need the server URL and a read token issued for that server. For the default local installation, openhttp://127.0.0.1:8080. For a shared instance, use the URL supplied by its
operator.
- Open the server URL in your browser.
- Enter the read credential in Read token, then choose Connect.
- Select the relevant team and environment in the application bar.
401 also clears the bearer session and requests a new
credential, while retaining the current route.
Navigate the workspace
The home screen accepts a trace ID or a tag value, such as a request identifier. A recognized trace ID opens that execution directly. Other text starts a tag-value search. Show All Traces opens the trace list without an identifier; Traces in the application bar returns to that list from another screen. The team and environment selectors set the scope of the workspace. A multi-team token can select a team or All my teams. A single-team token displays its team without a selector. All environments includes every environment in scope; Unset selects recordings with no environment label.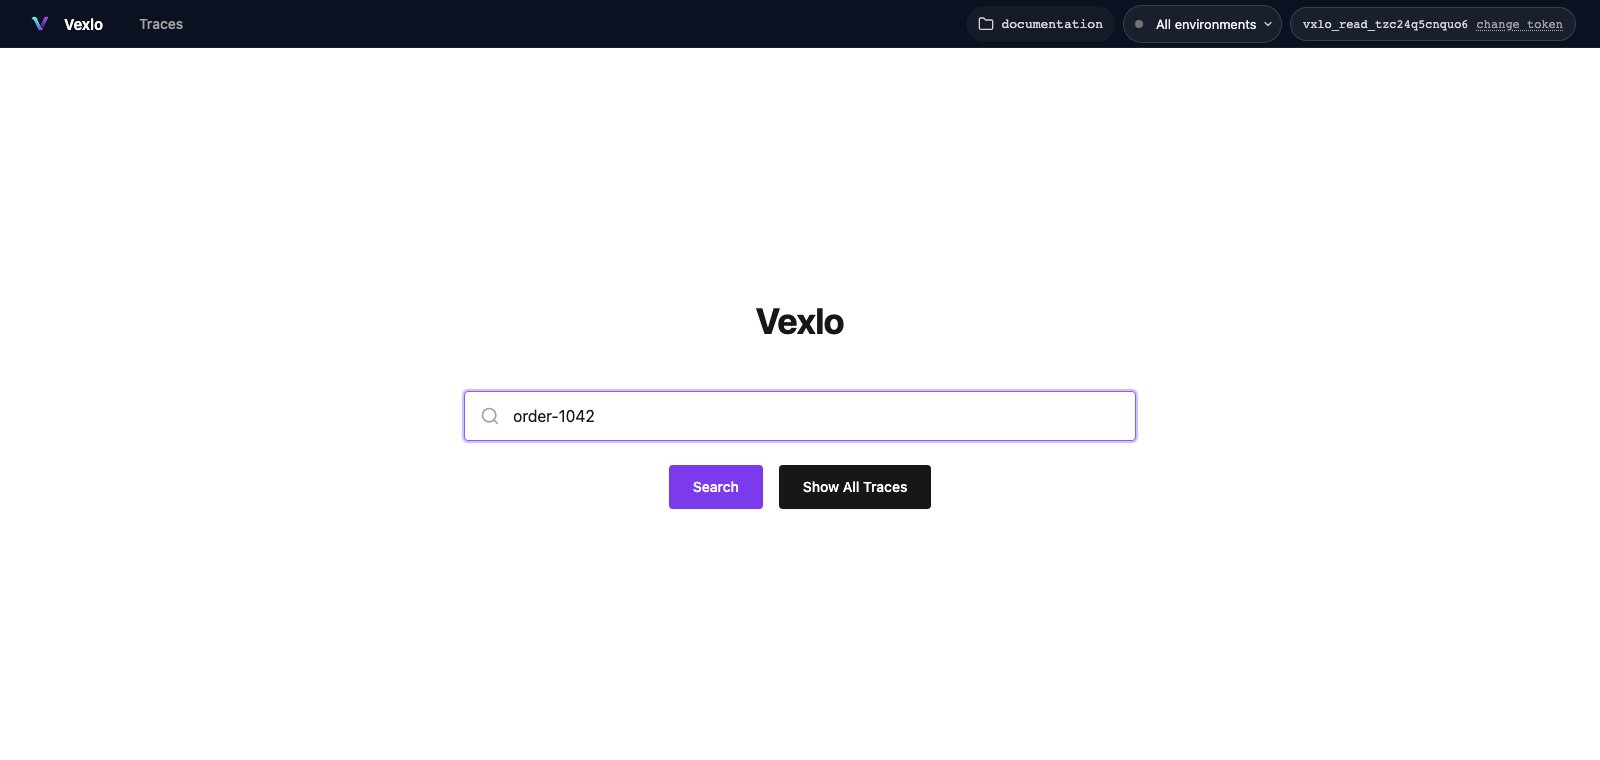
Find a recording with its request identifier.
Find an execution
On the Traces page, combine identifiers with service, time, function, duration and status filters. Root status describes the entry point. Has error includes a failed call attempt even when the request recovered. Recording completeness is a separate filter. Open a result row to inspect the execution. Search results are paginated; sorting a visible column reorders the current page rather than performing a new global sort. The Search traces guide documents each control, scope and result behavior.Read the trace workspace
A trace opens with execution identity and status above the visualization, and a details panel for the selected call. The main views organize the same loaded recording:
Selecting the root displays TRACE DETAILS. Selecting another call displays STEP DETAILS.
Large recordings can open in Table when their collapsed graph is too large; the other views
remain available. View changes use the loaded data, rather than fetching another trace.
Use Explore execution graphs for call navigation, attempt selection
and timing. A recorded parent is the nearest instrumented parent; an uninstrumented helper
can exist between displayed calls in the source.
Inspect a selected call
The details panel separates the call’s metadata from its captured values:
Values initially appear as previews. Use fetch full value when available to retrieve the
recorded bytes. The preview and the availability of full bytes are separate: storage retention
can remove bytes while leaving call metadata.
The Code tab is not a source-code browser or a complete relationship explorer. Use
Understand function usage for observed caller/callee names and real
executions through the HTTP API, with equivalent MCP tools for agents.
Inspect recorded values covers encoded representations, truncation,
unavailable data and the current limits of full-value retrieval across retry attempts.